The MDSI Metric Reports are a group of reports that include key information on your residents’ quality data.
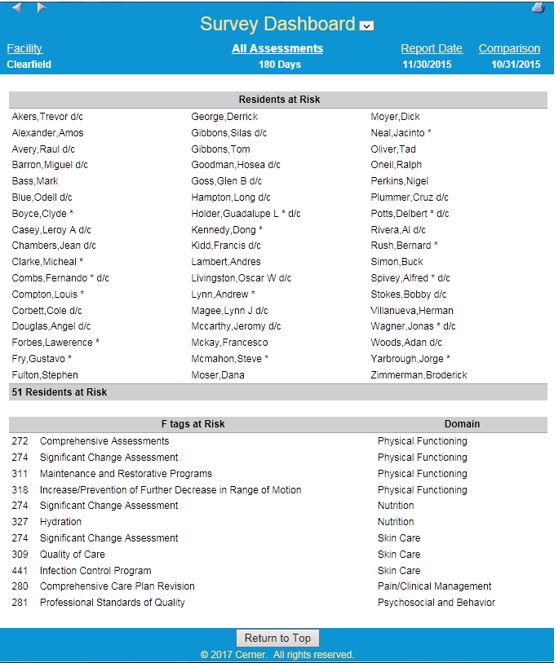
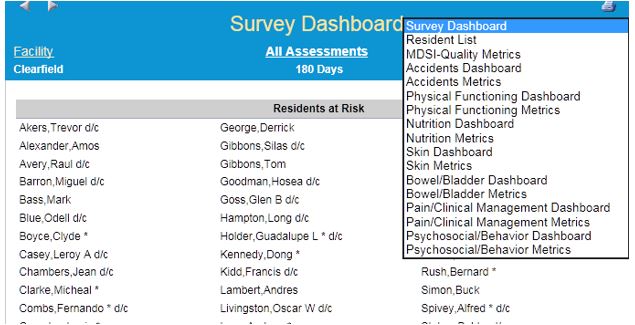
Survey Dashboard- The Survey Dashboard report will provide a list of residents and F-Tags that are at risk to be reviewed by a Survey team. Use this as a starting point or guide when doing your quality analysis of your MDS data.
Resident List- The Resident List report provides a list of all the residents who are included in your selected dates.
MDSI- Quality Metrics- This report contains quality metrics that are being reported on for you to keep a further eye on your quality, but are NOT current CMS quality measures. Quality Metrics in this report can include those that were formerly looked at and measured by CMS or additional quality metrics that are suggested by Long Term Care consultants to be reviewed.
Domain of Care Reports- Included in the MDSI Metrics list of reports are reports that break down information regarding these domains of care:
Accidents
Physical Functioning
Nutrition
Skin
Bowel/Bladder
Pain/Clinical Management
Psychosocial/Behavior
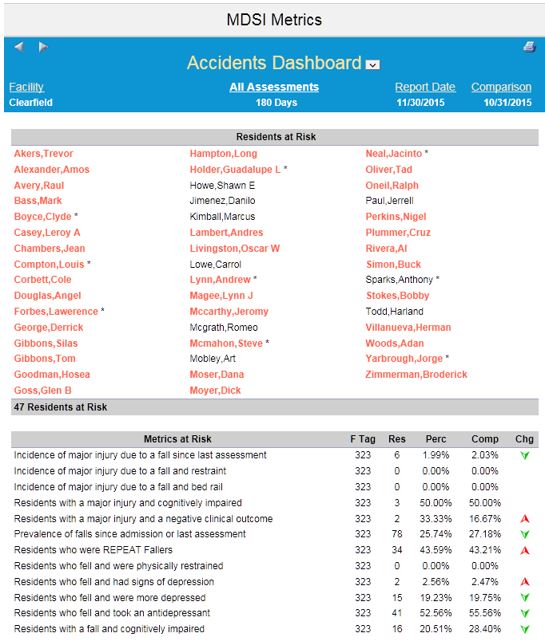
Each domain of care has two reports: a Dashboard and a Metrics report. The Dashboard report will show the Residents at Risk for triggering for an F-Tag in that domain of care, the metrics that could be triggered and their related F-Tag, the overall number and percentage of residents who could trigger for that metric in the selected time range, and whether this is an increase or decrease from the comparison time period.
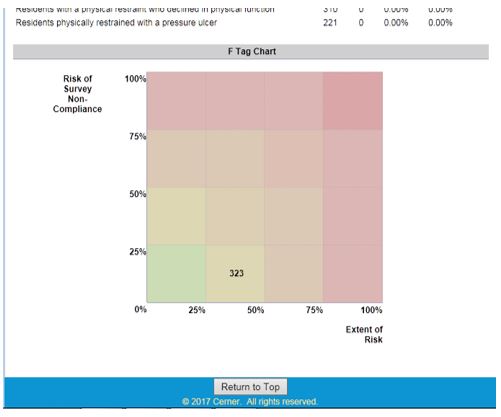
The bottom of the domain of care report’s Dashboard also contains an F-Tag Chart that displays the scope and severity of the F-Tags for which you’re at risk. “Risk of Survey Non-Compliance” indicates the severity of the F-Tag by percentage. The “Extent of Risk” indicates the percentage of residents, or scope of the F-Tag, who would be at risk for triggering that F-Tag.
Helpful Tip: When you have a report open, and you wish to move to another report, you can do so quickly and easily by selecting the drop-down to the right of the report title. Here you will see the other available reports and can just select one to view next.
Custom Reports
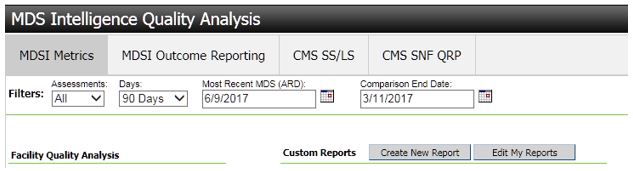
Each user has the ability to create a custom report containing only selected metrics from the Quality report. These reports will only contain the metrics you choose. Follow these steps to create a custom report:
1. Select Create New Report
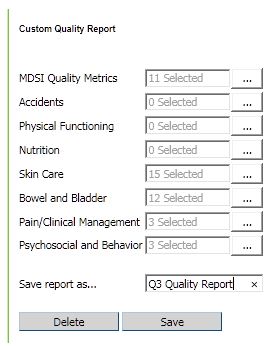
2. New page titled Custom Quality Report appears.
3. Select from each domain the metrics you want to include in the custom report. If selecting more than one from a domain, use the 'CTRL' button to select all that you want.
4. Enter the name of report following 'Save report as...'
5. Click Save.
To edit these reports (i.e. adding/removing more metrics or deleting the report)
1. Select Edit My Reports
2. Select 'Edit' following the report you want to change.
3. Once again, you are taken to the Custom Quality Report page where you can change your selections.
4. Click Save.